

Advanced Excel
 Skills You Should Know
 In this final installment of our Excel series we're going to talk about advanced Excel skills you should know. Because these are a bit more advanced we won't go into them in detail. These are the kinds of skills that online courses were created for.
Instead, we're going to briefly discuss each one, explaining what they are and how they can help you.
Advanced Excel Skills You Should Know
Pivot Tables
Understanding how to create and use pivot tables is an essential skill when you work with massive amounts of data. Pivot tables make it easy to summarize and understand all that data because they are interactive. They help us sort through the information, highlighting the information we need and displaying over all ideas.
Pivot tables can make your office life easier because they are fantastic reporting tools. You can quickly and easily create reports, and because they are so easy to use, your co-workers can use the pivot table you created to analyze data without asking you for assistance.
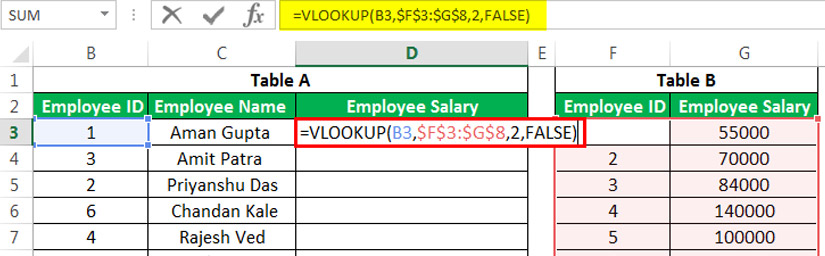
VLOOKUP and HLOOKUP
VLOOKUP is fairly popular, while HLOOKUP is a little less common. In reality, they are the same function. VLOOKUP is formatted to search vertically (columns); HLOOKUP is formatted to search horizontally (rows).
So what are they looking up? Specific information in your spreadsheet. Both functions easily locate the data you are looking for as long as you follow the specific guidelines. Which one you use depends on how your data is set up.
Charts
Charts may not seem like an advanced skill. Most people can create a basic chart in Excel, but creating useful charts that clearly show relevant data in an attractive way is a bit more difficult. To easily analyze data, the chart should be easy to read and understand. That means choosing the correct type of chart.
Excel has types of charts: pie, bar, line, column, area, and scatter. There are variations of each kind and sometimes there may be more than one good choice for the data you are presenting. The important thing is to present it cleanly.
Formatting & Check Formulas
Even if you aren't using charts, you need to present your data in an appealing way. Good data is worthless if it can't be understood. That's why it's so important to format your Excel spreadsheets correctly.
While good data is worthless if you can't read it, pretty spreadsheets are just as worthless if the data is incorrect. That's why you should always use check formulas and other functions to ensure the data - and the formulas - are as accurate as can be.
Macros
One of the most feared - but most helpful - Excel tools is the Macro. There's no need to fear, though. Using Macros can help you work faster and create more consistent reports by automating tasks. Technically you'll be writing code, but you don't have to actually know how to write code.
Macros can do pretty much anything you tell them to. They can set up formatting, add/delete rows, save in a certain way, refresh pivot tables, highlight certain cells, and more, all with the click of a button. Well, a click of the button once they are set up.
If you aren't familiar with the items we covered today, it's time to up your Excel game. Take a course on Pivot Tables, learn how to create macros to help you, or go all in and get certified in Excel.